Dish Antenna
Keywords:
-
radiation, GORAD
Problem Description
This problem illustrates how to import a basic STEP file, modify that CAD file and measure the energy deposition from ions.
Opening the Simulation
The Dish Antenna example is accessed from within RSim by the following actions:
- Select the New → From Example… menu item in the File menu.
- In the resulting Examples window expand the RSim for Basic Radiation option.
- Expand the Basic Examples option.
- Select Energy Deposit on Dish Antenna and press the Choose button.
- In the resulting dialog, create a New Folder if desired, and press the Save button to create a copy of this example.
All of the properties and values that create the simulation are now available in the Setup Window as shown in Fig. 50. If you expand the tree elements and navigate through the various properties, the dish becomse visibile after **unchecking* the particle source (sphere), and tally energyDepositMesh (grid).
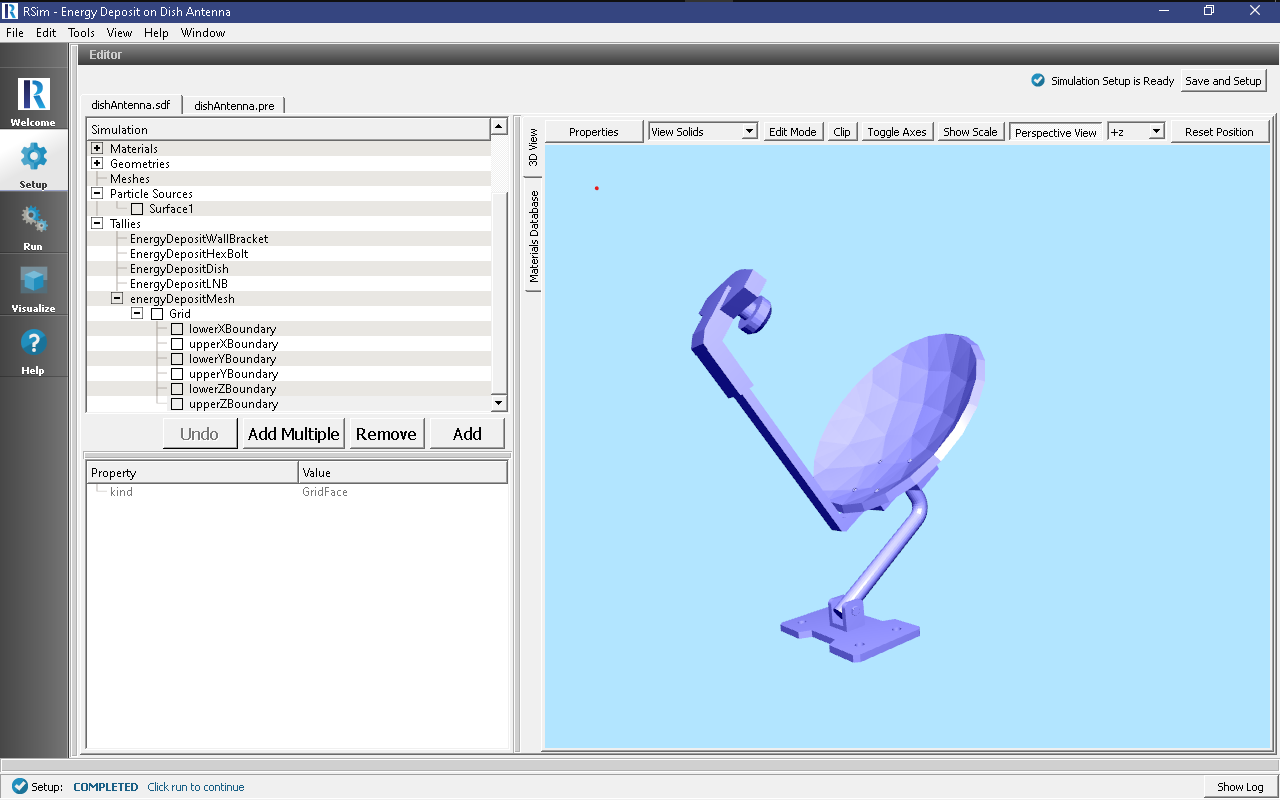
Fig. 50 Setup Window for the Dish Antenna example. The mesh tally used in this simulation can be seen in the 3D View, along with the sphere that will be shooting particles at it.
Simulation Properties
This example demonstrates use of a very simple CAD file and how it can be imported, moved in the simulation window, given materials, and bombarded with ions. Two parts of the Dish Antenna, the “Wall Bracket” and “Hex bolt” have been combined with a union operation. This is possible by selecting each, right clicking, and performing the boolean operation, union.
Under the Basic Settings tab the number of events to be simulated can be selected.
A particle source is created with 100 MeV energy.
Energy Deposit tallies have been assigned to all objects, as well as a 50x50x50 mesh covering the volume that encompasses the antenna. This can be used to view energy deposition at a higher fidelity.
Running the Simulation
After performing the above actions, continue as follows:
- Proceed to the Run Window by pressing the Run button in the left column of buttons.
- To run the file, click on the Run button in the upper left corner of the Logs and Output Files pane. You will see the output of the run in the right pane. The run has completed when you see the output, “Engine completed successfully.” This is shown in Fig. 51.
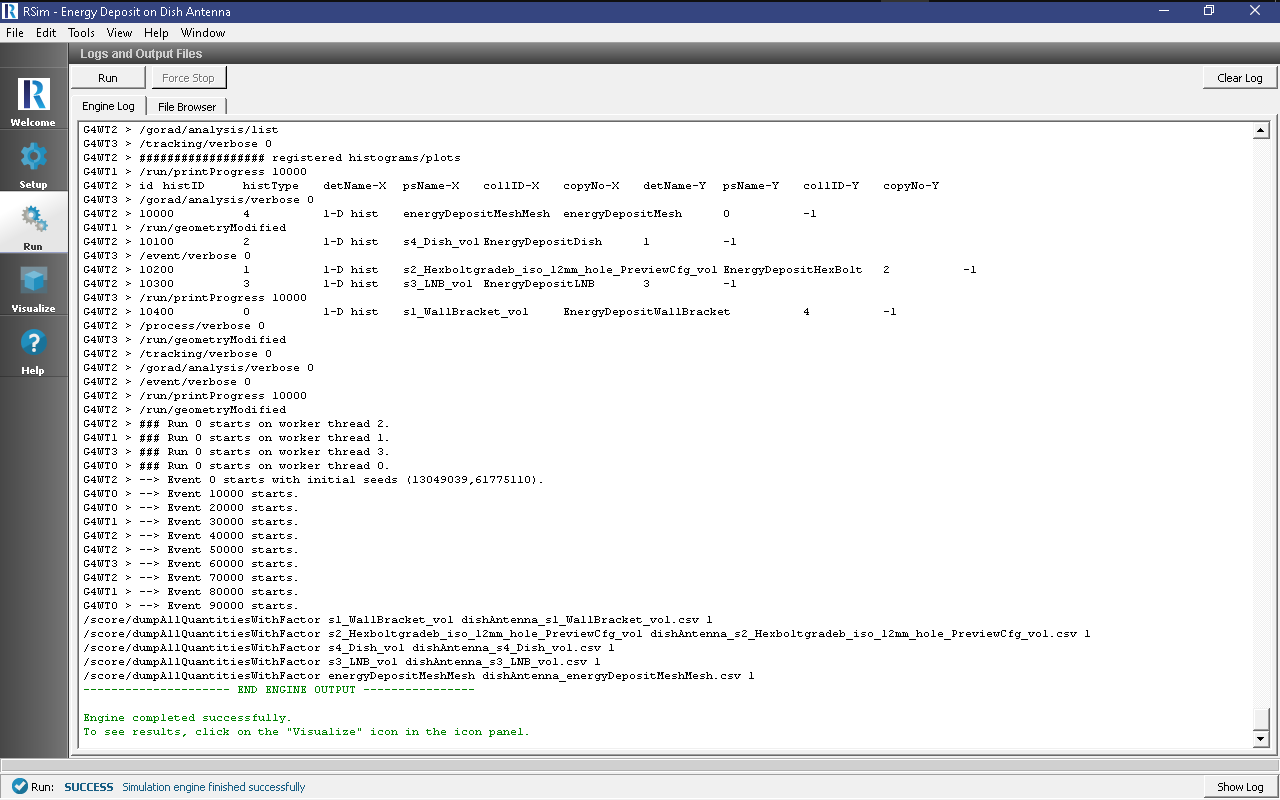
Fig. 51 The Run Window at the end of execution.
Visualizing the Results
After the run has completed the results of all tallies can be visualized.
To view the energy deposit on various parts of the dish, follow these instructions (Fig. 52):
- Expand Scalar Data
- Check EnergyDepositDish
- Check EnergyDepositHexBolt
- Check EnergyDepositLNB
- Check EnergyDepositWallBracket
- Rotate the visualization as shown in the image below
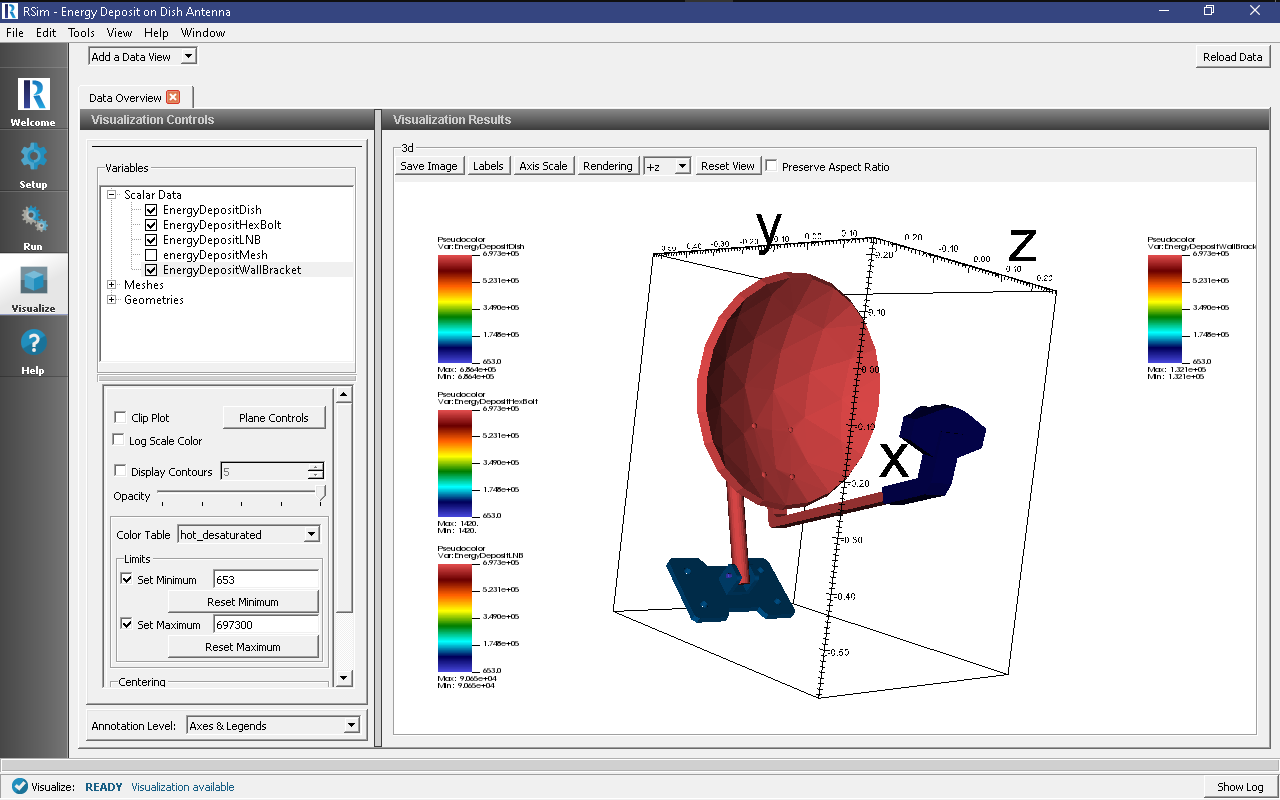
Fig. 52 A visualization of the volume tallies
Further Experiments
Try altering the ion used in the simulation to see how energy depositions are affected. Try altering the number of cells in the mesh to improve the granularity of the results. This can be used to help show the concentration of particles across a surface, as well as show penetration depth of the particles.