Simple Ion Source (simpleIonSource.sdf)
Keywords:
- coherent ion beam, electron emitters, electron-neutral collisions, plasma source
Problem Description
This simple ion source example illustrates how to generate an electron population by emitting electrons off of a cathode. The charge neutral plasma forms due to electron-neutral collisions which ionizes the neutral fluid to generates a second electron (in each collision) and a singly charged positive ion. The ions are then extracted from the plasma source with two extraction plates biased to a large negative potential. The two extraction plates accelerate the ions out of the plasma generating an ion beam which is focused to a small width according the space between the two extraction plates. To further focus the ion beam, absorbing plates are placed above the extraction plates which further focuses the ion beam to a smaller width. A magnetic field can also be imposed to further restrict the motion of the ions. For the example shown here a SpaceTimeFunction is used to define the magnetic field but we have not included the magnetic field in the simulation. The user is free to add this magnetic field to perform further tests on the setup.
This simulation can be run with a VSimPD license.
Opening the Simulation
The simple ion source example is accessed from within VSimComposer by the following actions:
Select the New → From Example… menu item in the File menu.
In the resulting Examples window expand the VSim for Plasma Discharges option.
Expand the Ion Sources option.
Select Ion Source and press the Choose button.
In the resulting dialog, create a New Folder if desired, then press the Save button to create a copy of this example.
All of the properties and values that create the simulation are now available in the Setup Window as shown
in Fig. 548. You can expand the tree elements and navigate through the various properties,
making any changes you desire. Please note that many options are available by double clicking on an option and
also right clicking on option. The right pane shows a 3D view of the geometry as well as the grid, if
actively shown. To show or hide the grid, expand the Grid element and select or deselect the box next to Grid.

Fig. 548 Setup window for the Simple Ion Source example.
Simulation Properties
This example contains many user defined Constants which help simplify the setup and make it easier to modify. The following constants can be modified by left clicking on Setup on the left-most pane in VSim. Then left click on + sign next to Constants and all the constants used in the simulation will be displayed. To add your own constant, right click on Constants and left click on Add User Defined. Below is an explanation of a few of the constants used. There are several more constants included in the simulation.
XMIN/XMAX,YMIN/YMAX,ZMIN/ZMAX: Physical dimensions of simulation in meters.
CATHPOT: Potential of electron source from which electrons are emitted
B0: Magnetic of external magnetic field (if you choose to include this)
T0: Time that the electrons are emitted from the electron source.
Running the Simulation
Once finished with the setup, continue as follows:
Proceed to the Run Window by pressing the Run button in the navigation column out left.
To run the file, click on the Run button in the upper left corner of the Logs and Output Files pane.
You will see the output of the run in that pane. The run has completed successfully when you see the output, “Engine completed successfully.” This is shown in Fig. 549.
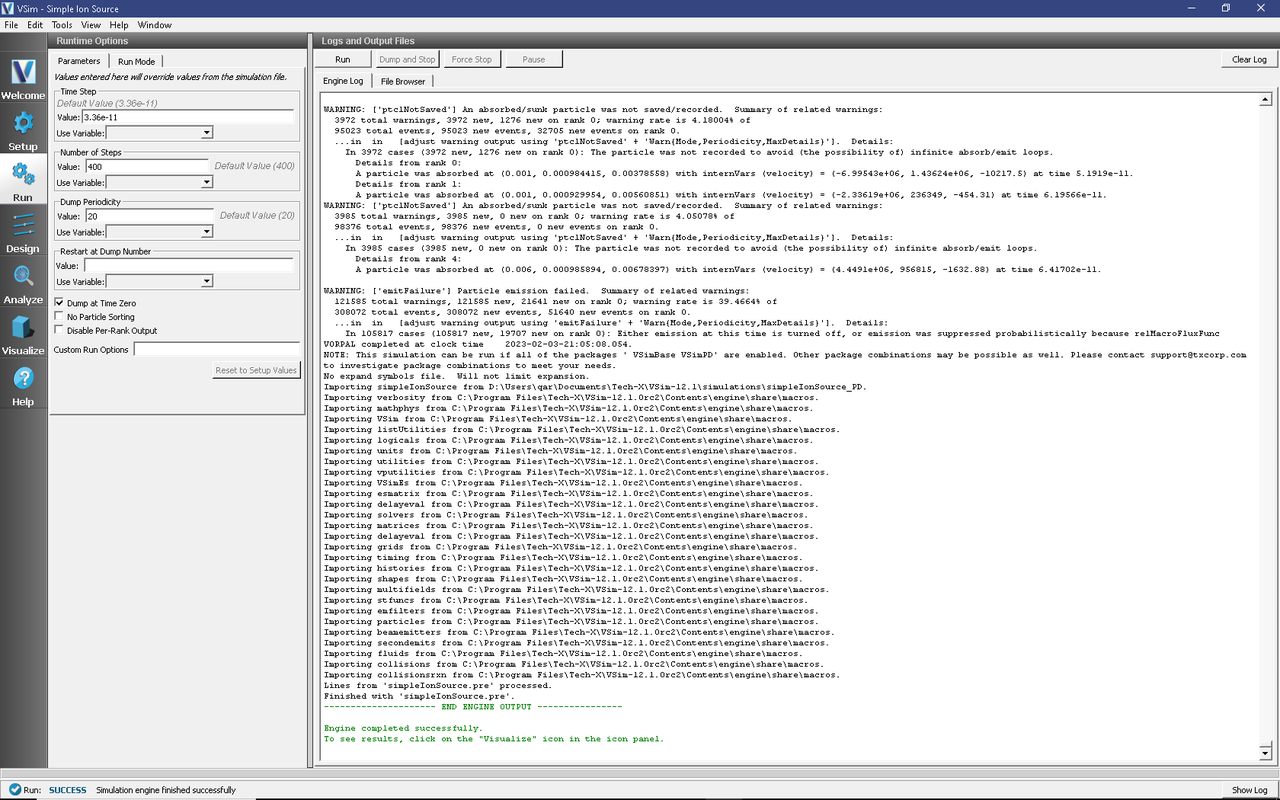
Fig. 549 The Run Window at the end of execution.
Analyzing the Results
After performing the above actions, continue as follows:
Proceed to the Analysis Window by pressing the Analyze button in the navigation column.
In the list of Available Analyzers , select computePtclNumDensity.py and press Open* The analyzer fields should be filled as below:
simulationName: simpleIonSource
Fill in SpeciesName with “electrons” or “Ions” which are the names of the two species in the “Particle Dynamics” tab in the visual setup.
Click Analyze in the top right corner.
The analysis is completed when you see the output shown in Fig. 550.
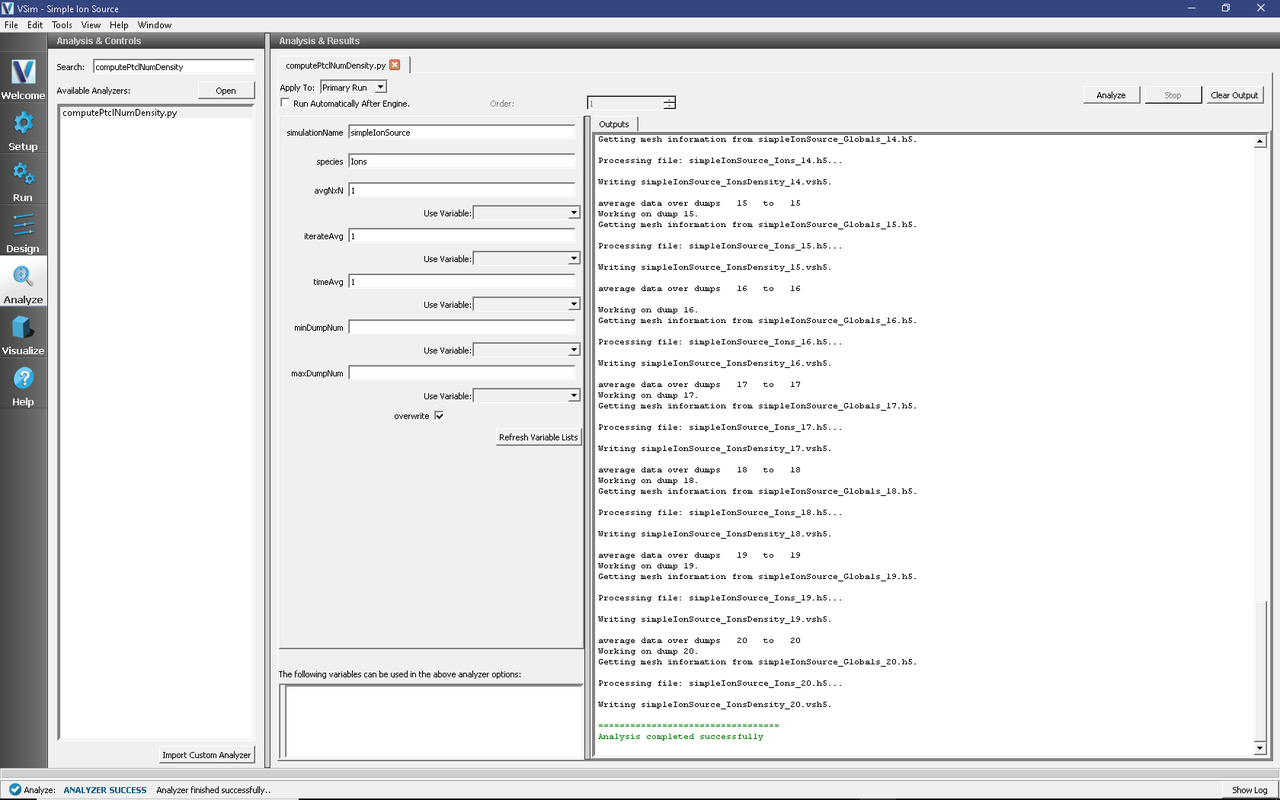
Fig. 550 The Analyze Window at the end of a successful run.
The resulting data is called electronDensity and IonDensity and shows the number density in the 3D simulation domain in units of #/m^3.
Visualizing the Results
After performing the above actions, the results can be visualized as follows:
Proceed to the Visualize Window by pressing the Visualize button in the navigation column.
Clicking on the Data View dropdown menu shows there are many different types of data to visualize.
To get started, lets visualize the formation of the plasma at the bottom near the cathode and the resulting ion beam.
Click on Data View then click on Data Overview
Under Variables, click on “Particle Data”, “electrons” and the top most box (“electrons”)
Click on “Ions” then click on the top most box (“Ions”)
Finally, to visualize the plasma species in the context of the geometries in the simulation, click on “Geometries”, “poly(extractionPlate1)”, “poly(extractionPlate2)”, and “poly(electronSource)”.
You can rotate the figure by holding down the right mouse button and moving the mouse.
The resulting visualization is shown in Fig. 551.
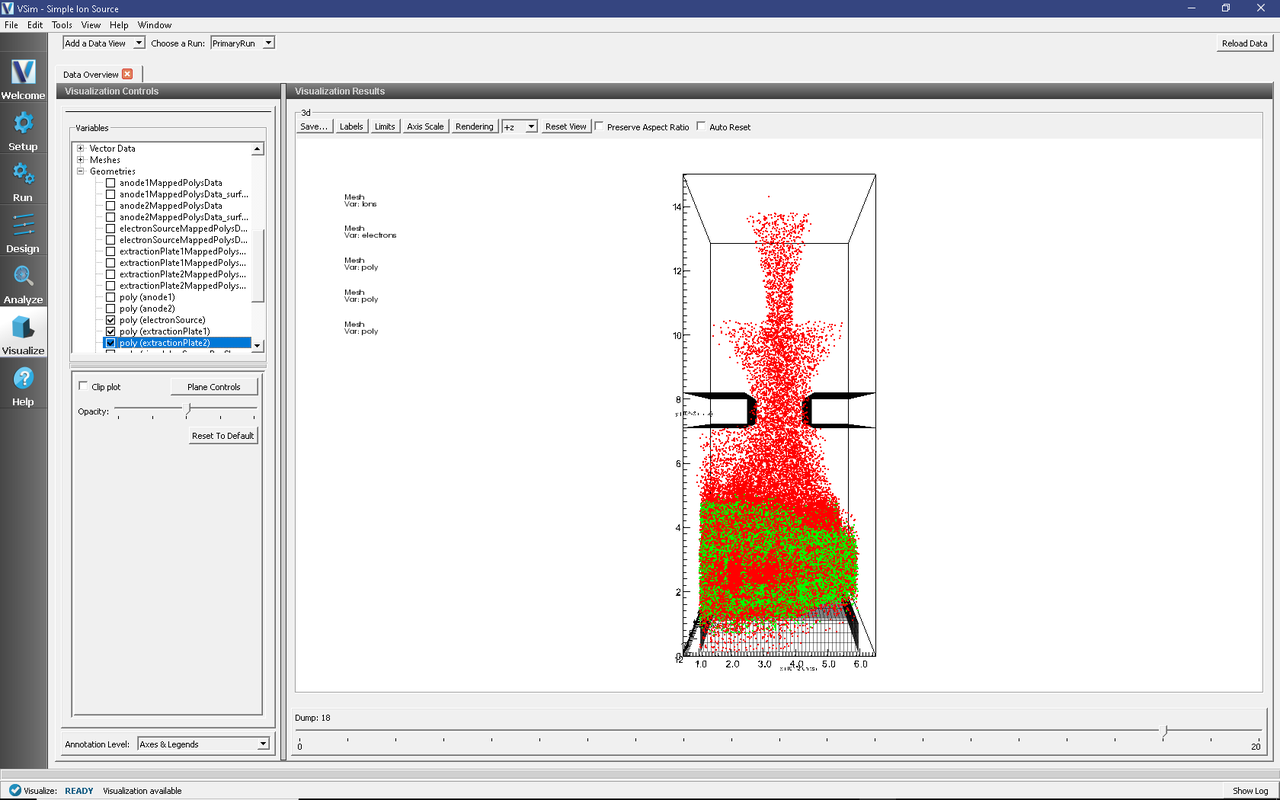
Fig. 551 The evolved ion beam near the end of the simulation.
This plot shows that the ions have been extracted from the plasma reservoir to form a coherent ion beam.
Next you can visualize the potential. Click on “Data View” at the top left of the Visualization window. Then click on “Field Analysis”. A new tab will open called “Field Analysis”. In the “Field Analysis” tab, click on the arrow next to the “Field” option and you will see all the available fields for visualizing. Click on “Phi”, which is the potential. To get a 2D view with a 1D slice of the data click on “Side-by-side 2d/1d” next to the Layout option. Under “Slice Settings”, change the value from 0 to 0.005, then hit Enter. Now the data is being shown in the 2D plane at z=0.005 m. Finally, you can slide the bar under the “Vertical,Horizontal,Advanced” tabs to change the 1D slice that is shown. You need to click on “Perform Lineout” to see the new slice. To change the axis labels, click on “labels” in the respective plots.
The visualization window showing the potential is shown in Fig. 552.
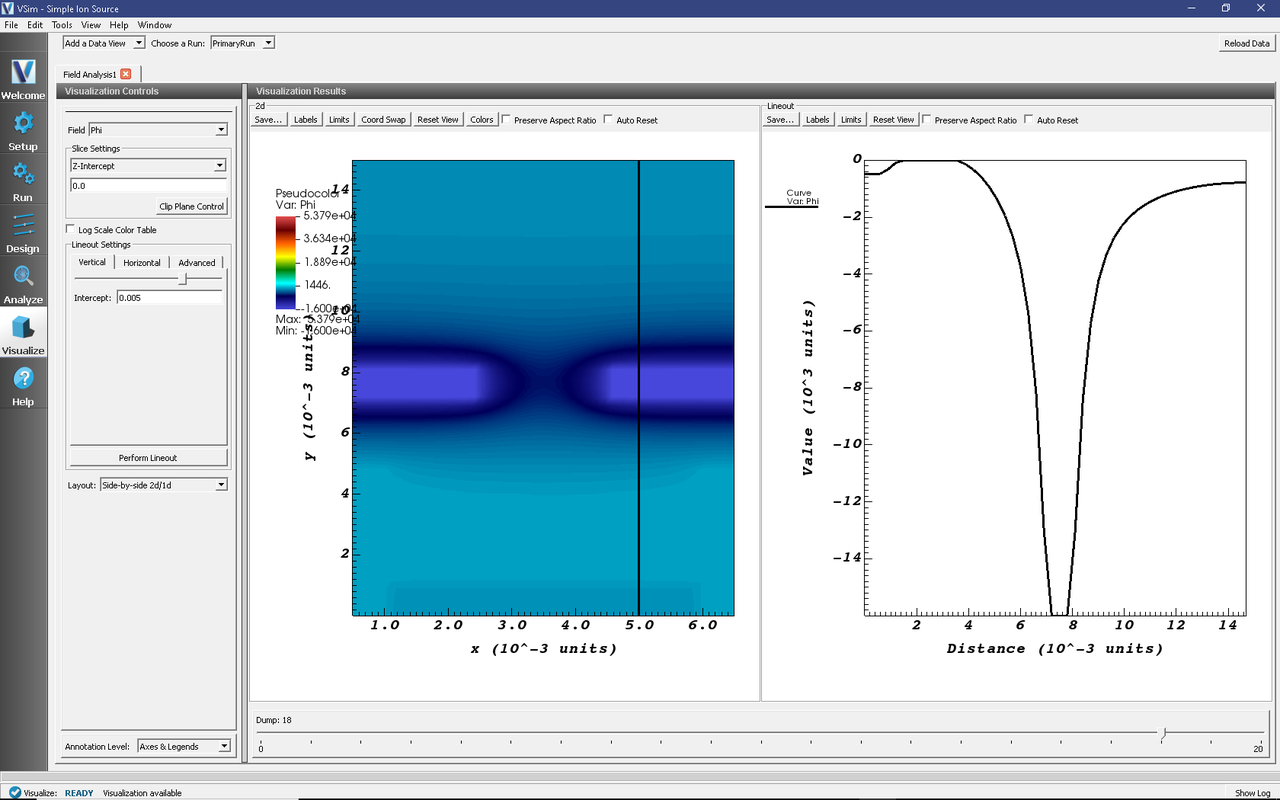
Fig. 552 Plot showing the 2D potential in the z=0.005 m plane along with a 1D plot along the y-axis (at a fixed value of x).
Further Experiments
In this example simulation, we have reduced the ion mass to illustrate some key aspects of the capabilities in VSim. For example, we illustrate the formation of the plasma in the plasma source region. As the plasma builds up, the ions are extracted from the plasma source region by the “extraction plates”. The ions will also be attracted to electrons in the plasma source region due to the ambipolar electric field which is created by the spatial separation between the ions and electrons. This example can be used to design an experimental setup with realistic ion masses. With larger masses, the ambipolar electric field makes it more difficult for the ions to escape. Therefore, the following modifications can be performed to test more realistic scenarios. (1) Change ion species to hydrogen. (2) Modify “T0” which is the time that the electrons are emitted from the electron source. Increasing T0 means that the ions source becomes more dense. For heavy ions, you will need to modify this so that the ambipolar electric field does not become too large thus pulling the ions back in to the plasma source region. (3) Modify “EPYPosition” which is the distance along the y-axis the extraction plates are plates.